


One of our new holdings is up 80% in 43 days
What can we learn from that?

One of the picks from the “Screening for Our Next Winner” series just happened to publish tremendous Half-Year 2024 results…one week after we added the company to the Mr Mimetic Fox Fund.

Sales were up 87% compared to the first half of 2023.
Those results were not totally unexpected.
Somewhat, but not totally.
There was a huge surge in outstanding orders since the US opened as a market for the company.
“Order Quantities” is a huge KPI (key point of interest) to keep an eye on for this company. Those orders were already communicated in May 2023.
Those sales were bound to materialize, only they were completed sooner than expected. So, that was the surprise.
Going further into their fiscal year, this kind of stellar boost to the sales and earnings cannot be expected. Compared to the first half, sales probably will decline a bit in the second half.
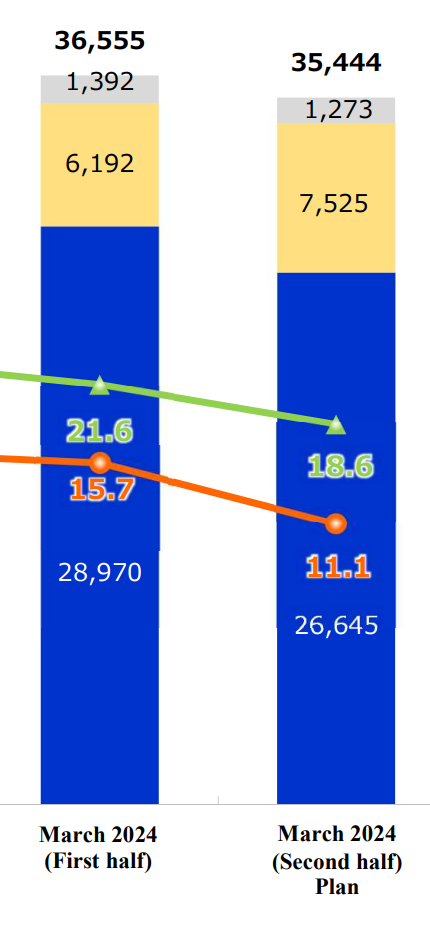
Results will still be pretty good on a yearly basis, though. But not 87% kinda good.

Going a bit further into the future, management expects sales to grow by 40% from now, up to 100.000 million yen for the FY 2027 as part of their mid-term business plan. Reasonable growth. Nothing extra-ordinary.
(Especially when your forecast is calculated in a weakening yen, but you can make sales in US$; that’s how you can make inflation work for you)
Long term, the business should add more and more maintenance contracts to the mix. Once they build an installation, that installation needs to be maintained. When they have installed in all their new markets, this service-based income will have predictable cash flows. That is the thing to look for.
However, there are a few other things to unpack here.
Unboxing the lessons-to-be-learned.
What is cheap?
The stock was cheap to begin with.
Now, after an 80% run-up, the stock is still cheap.
Not reasonably priced.
Cheap.
If not for the rules of the fund…
Whenever a company in the Mr Mimetic Fox Fund can pass the 9-step hurdle on the date of their yearly results, there will be additions to the position
….Mr Mimetic would have been buying a bigger pie of the company head over heels.
After revisiting the results of the “winning” stocks from the original report “The Making of a Multibagger”, Mr Mimetic already decided on the observation that despite what the authors of the report promised…
“Don’t rely on multiples: (…) Many of the top performing stocks began with already healthy multiples – those multiples often expanded even further. “- Alta Fox Capital “Makings of a Multibagger”
…valuation does matter.
Multiples matter.
Since we have 40.000 stocks to pick from, we have the luxury of being nitpicky when it comes to valuation.
So, despite the original Alta Fox Capital criterium for “cheap”…
3x trailing Sales
20x trailing EBITDA
30x trailing PE
… Mr Mimetic has observed that an EV/EBITDA ratio of < 15 betters the probability of multiple expansion in the next few years going forward.
So when your playing field is 1 or 3 or 5 years? Valuation matters.
Accidentally, according to Tradingview, the current EV/EBITDA ratio of the company is 8.25.
Still some runway ahead.

Compounding Rate
Naturally, Mr Mimetic decided to look a bit deeper: is there a pattern or certain quality about this company that makes it special?
Of course, there is. (Otherwise, the company would not be part of the Mr Mimetic Fox Fund.)
Should we not add that “special thing” as an extra hurdle rate to our existing 9-item list to evaluate companies so we can ameliorate the odds of finding winning picks in the future?
What is that special thing, then?
A blog post about the company TopBuild by Kairos Research hints at one particular subject that is lacking in the Alta Fox Report:
“One of my favorite ways to calculate return on invested capital is to look at how much capital has been invested into a business over a period of time and then look at how much additional earning power the company is now enjoying because of it.” - Kairos Research
Return-on-Invested-Capital is completely absent in the analysis by Alta Fox Capital of what makes a multi-bagger.
It is simply a blind spot.
Which is odd, since…Charlie Munger predicts that Return-on-Invested-Capital foreshadows your returns in the stock market:
"Over the long term, it is hard for a stock to earn a much better return than the business which underlies it earns…If a business earns 18 percent on capital over 20 or 30 years, even if you pay an expensive-looking price, you'll end up with a good result." - Charlie
Charlie says 2 things here:
over a long enough time frame valuations matter less and less (confirming the Alta Fox Capital people - but Mr Mimetic is adamant: 5 years is too short for valuations not to matter)
most important is persistence in the level of ROIC
Kairos Research talks about “additional earning power”, though. That is the real special sauce:
“Leaving the question of price aside, the best business to own is one that over an extended period can employ large amounts of incremental capital at very high rates of return.” – Warren Buffett, 1992 Shareholder Letter
What Warren says here is that it’s not only important how much you can earn on any given day compared to the capital you invested to first start and then run the business, what is even more important is whether you can re-invest the profits in growing the business. That is what “incremental” means: in addition to.
So, two questions are important:
how much of the money you earn can you re-invest in further growing the business?
what are your returns on that extra invested money? Or: how much extra do you profit from the extra investment?
To answer the first question, you need to calculate the so-called “Re-investment Rate”.
To answer the second question, you need to figure out the “Return on Incremental Capital Invested”.
Those two questions combined give you:
Re-investment Rate x Return on Incremental Capital Invested = Compounding Rate.
Not the extreme height of a Compounding Rate is of particular importance since we have seen plenty enough companies reverse to the Mean - due to heightened competition, or lack of re-investment opportunities.
What is most important, then? How persistent that Compounding Rate is.
The single biggest and most difficult task of an investor is to predict exactly this:
Can a company keep up its Compounding Rate?
How will it do it? Why will it do it?
The second task is: how much are you willing to pay for that?
In practice that becomes: how much are you willing to risk on the fact that you are right?

The Mr Mimetic Fox Score
To bring all these concepts together, Mr Mimetic contrived a Single Number that should tell you the relationship between the Quality of the Company and the Price of the Company.
It is a bit math-y. But bear with us.
It should be fun.
STEP 01.
So, in the case of this company (which you could’ve guessed by now if you followed the hyperlinks), Mr Mimetic first looks at the earnings they have made in the last 5 years.
Ebitda, Ebit, Net Income, Free Cash Flow.
You don’t look at those in any given year, you look at the cumulative earnings: e.g. EBITDA from years 01, year 02, year 03, year 04, and year 05 all added up together.
You can look at the last 10 years of 20 years to see if the same ratio pops up (but you risk being late to the party.)
The great advantage is you can excuse one year when things didn’t go as planned. You look at:
What total sum have they earned in the last 5 years?
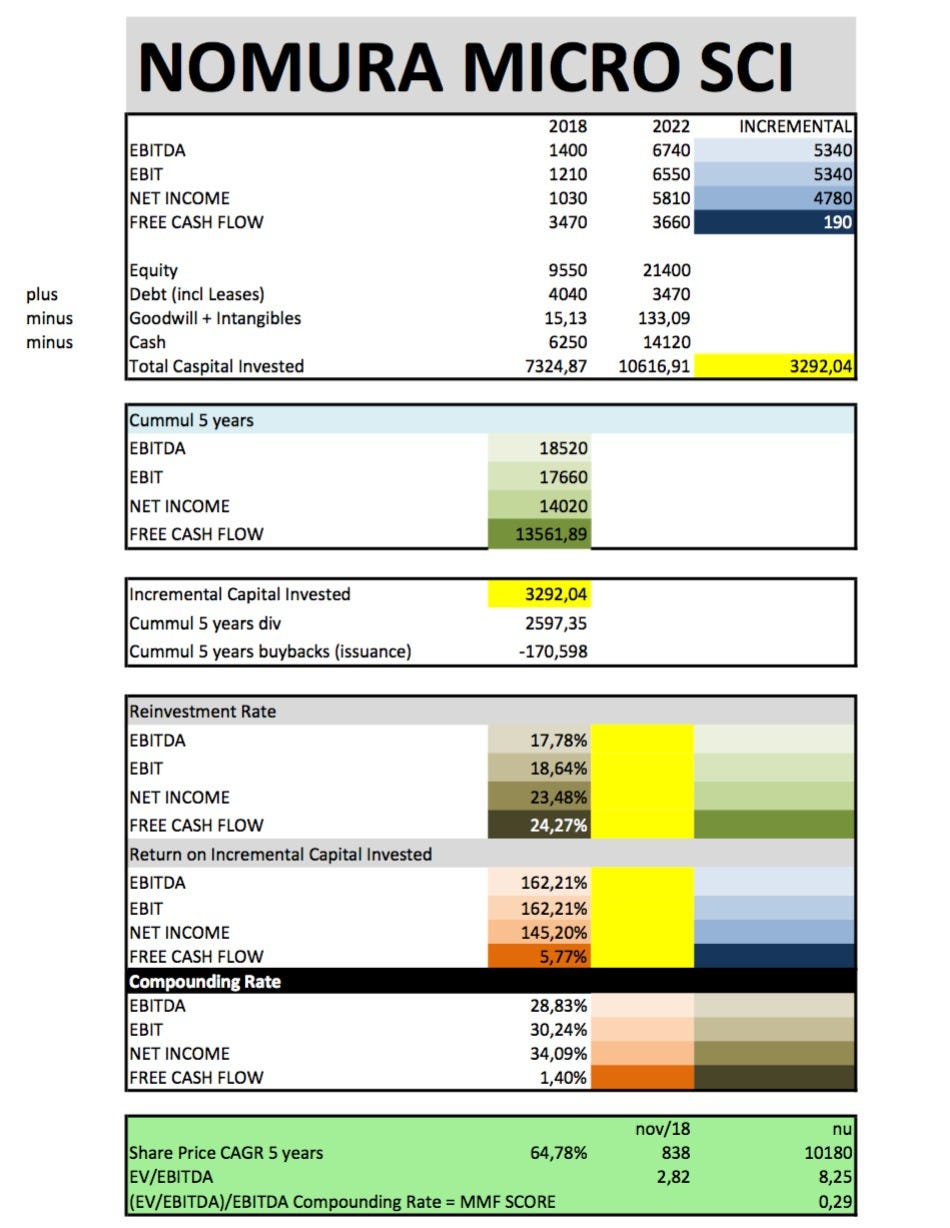
In this case, for this company’s EBITDA you get:
2018: 1.40B
2019: 2.02B
2020: 3.75B
2021: 4.61B
2022: 6.74B
Cumulative: 1.4 + 2.02 + 3.74 + 4.61 + 6.74 = 18.51B in EBITDA
STEP 02.
Once we have that number, you look at the Invested Capital now versus the Invested Capital 5 years ago.
There are many different ways to go about this, but Mr Mimetic likes this method:
Equity + Debt - Intangibles - Cash = Invested Capital
What you want to figure out is: how much additional capital has been invested in the business over the last 5 years?
So you subtract the Invested Capital from 5 years ago, from the current Invested Capital:
Invested Capital Now - Invested Capital 5 years ago = Incremental Invested Capital
This is how much extra capital was invested in the business over the last 5 years.

Mind you, some of the holdings in the Mr Mimetic Fox Fund were able to increase their earnings, with a shrinking Capital Invested base. So the Incremental Invested Capital is negative. This is a sight to be cheerful about.
STEP 03.
Now you know how much of what they earned in the last 5 years was invested back into the business.
Incremental Invested Capital / cumulative earnings = Re-Investment Rate
3292,04 / 18510 = 17,78%
Only about 1/5th of all the EBITDA in those 5 years ended up re-invested in the business.
The rest is still in the business in the form of cash (+8b); some debt was repaid (0.6b) and there was a dividend pay-out of 2.5B during those 5 years.
And of course, since EBITDA is Earnings Before Interest, Taxes, Depreciation, and Amortisation… that is where the rest went. (The re-investment rate for Net Income was close to 24% and for Fre Cahs Flow over 24%)
STEP 04.
We do know the Incremental Invested Capital by now, but we also need to know the Incremental Earnings.
How much more has the company earned in the most recent year versus 5 years ago?
In this case, for EBITDA we get:
2018: 1.4B
2022: 6.74B
Incremental EBITDA: 6740 - 1400 = 5340
5.3B in EBITDA was earned extra when you compare 2018 with 2022.
STEP 05.
Now we know this, we can calculate the Return on Incremental Capital Invested:
Incremental Earnings / Incremental Capital Invested = Return on Incremental Capital Invested
For this company, this turns out to be:
5.34 / 3.292 = 162%
With only 3.3 billion in extra capital they were able to earn 5.3b more… Quite the feat.
STEP 06.
Now we go to our precious Compounding Rate.
Return on Incremental Capital Invested * Re-Investment Rate = Compounding Rate
162% * 17.78% = 28.8%
This is obviously high. If they can keep up this pace in the coming 5 years, the value of the company should compound at about 30% per year.
When we do the same calculations with different earning lines, we get these Compounding Rates:
EBITDA 28.82%
EBIT 30,24%
NET INCOME 34,09%
FREE CASH FLOW 1,4%
Free Cash Flow is the outlier here because Free Cash Flow in 2018 was over 3x bigger than Net Income. Incremental Free Cash Flow was thus almost non-existent. (Free Cash Flow in 2022 was lower than Net Income and about half of EBITDA, which is back to normal)
Mr Mimetic would never only rely on EBITDA. Better is to compare all earning lines and how they behave on an Incremental basis.

STEP 07.
If we are confident they can keep up such a great Compounding Rate in the years to come, now we can check how much we should pay for this kind of outperformance.
Is our company cheap or not?
When we would’ve looked at earnings-per-share this would be a simple case of the PEG-ratio.
Which is:
(Price-per-share/earnings-per-share)/growth
If the ratio is under 1, you can consider the company undervalued.
If the result is above 2 then you can conclude the company is definitely over-valued.
Since we look at EBITDA and EV/EBITDA as a proxy, we can use this calculation as an exercise:
(EV/EBITDA)/EBITDA Compounding Rate = Mr Mimetic Fox Score
Since the EV/EBITDA comes at 8.25 for this company…
And the Compounding Rate at 28.8…
…the Mr Mimetic Fox Score for this company right now becomes 0,29 (8.25/28.8) = well below 1 and thus probably quite undervalued.
When you want to keep a margin of safety you can install the rule that you wouldn’t buy a company that scores above 0.5 on the Mr Mimetic Fox Score.
You should do quite well, in that case.
You should also do quite well with this company going forward, even after an 80% runup in 43 days.
Provided, of course, that they can keep up this Compounding Rate.
(Something Mr Mimetic thinks they have a good probability to do because there are new markets, new industries, and new business models opening up for them. Mind you: the 87% increase in sales of the recent half year is not yet included in this calculation; the 30% is based on the 5 years prior)

A “Compounding Rate” of about 30% is truly extraordinary. As is a “Return on Incremental Capital Invested” above 100%.
They keep a lot of cash in the company, so there are possibilities for acquisitions, R&D… Buybacks would be a great capital allocation decision on their part, right now.
These numbers show you that something special might be going on right there.
Keep in mind that all this math is useless if you cannot get a sense of how they might repeat these numbers in the future.
The coming 5 years. The years beyond that. Going the distance.
They don’t have to grow sales 87% every half year to do that. There can be lumpy quarters, lumpy half-years, and lumpy years. If they can pull it off in stretches of every 5 years? Shareholders should be very fortunate.
So be aware: management of Nomura guides only 40% growth from now until FY 2027. Upcoming orders for fiscal 2025 are at the moment a lot lower than fiscal 2024.
Although the valuation is cheap when compared to 30% compound; the valuation is not so cheap when compared to a 10-ish% compound. (Still not expensive, though)
In conclusion: you have to be convinced that the probability of pleasant surprises is higher than that the results will follow guidance.
BRINGING IT ALL TOGETHER
The great thing about Compounding Rate is that it blends the Income Sheet & the Cash Flow Sheet with the Balance Sheet.
What is the Capital you need in this business? How much do you earn with that Invested Capital? How can you Re-invest some of that earnings in buildings, in R&D, in new markets, in new countries? How much do you earn on that?
You can plot Compounding Rate for 5 years, on 10 years, on 20 year,s or on a 5-year Rolling Basis (so your most recent results don’t blur your vision of the underlying business dynamics).
So Compounding Rate will definitely be the 10th item on our list of criteria to decide whether a company belongs to the Mr Mimetic Fox Fund.
And the Mr Mimetic Fox Score will be included in considering if a stock is cheap enough. Also, the Score will be included in the report of our holdings, next to EV/EBITDA and Compound Rate to gauge whether our holdings are still cheap or not.
(When you are a paying reader you get updated on the positions in the fund and their ratio’s)
There will also be an 11th item on the list, but that is for another time…
Thank you for reading this far into the post.
(It was a handful.)
Kind regards,
Mr Mimetic
If you liked what you read, consider sharing this post with your investing aficionados.
SOME SOURCES
Mr Mimetic first came into contact with the concept of Compounding Rate and Incremental Returns many years ago, through the writings of Geoff Gannon - who you can follow now @ Focused Compounding.
John Huber of Saber Capital and Base Hit Investing fame gave a very fine explanation of Compounding Rate in a series about ROIC or Return-On-Invested-Capital, also many years ago.